About Information Visualization
Information Visualization (InfoVis) aims to increase the value of large data sets using interactive graphics. When data is viewed graphically, useful insights can be found. However, creating useful visualizations is often technically difficult and time-consuming.
The goal of my research is to make the process simpler and more insightful. This is achieved by storing and reusing knowledge about the source data and the visualization technique. This knowledge is stored in structures called ontologies. Using a technique called ontology mapping, all of the permutations for visualizing the data are modelled and given a usability score. The user is shown the highest scoring visualizations. As the user explores the recommended visualizations, the system updates the knowledge stored in the ontologies to further improve the system.
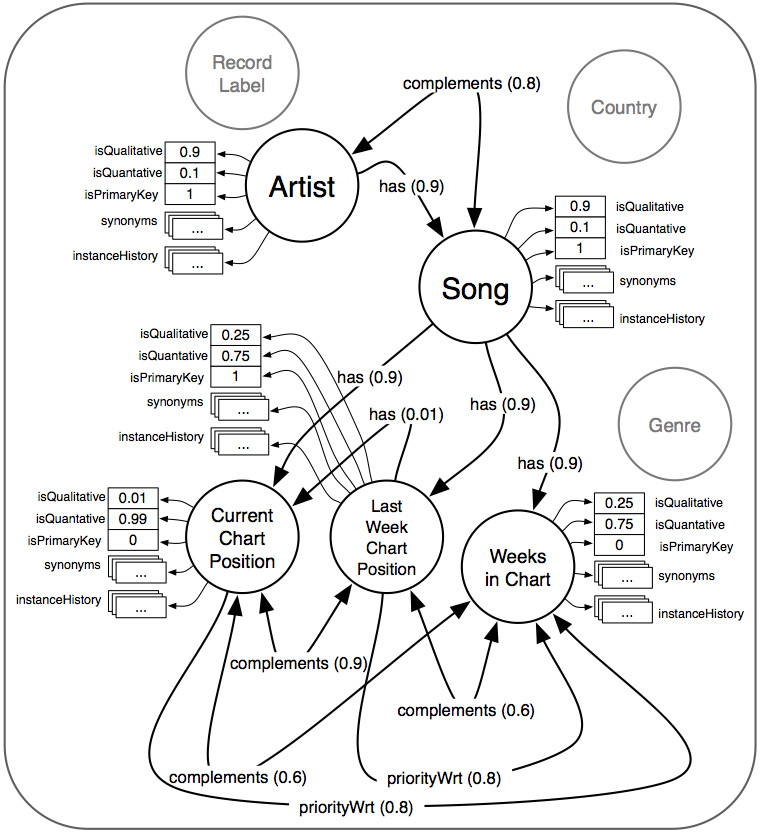 Domain Ontology (DO)
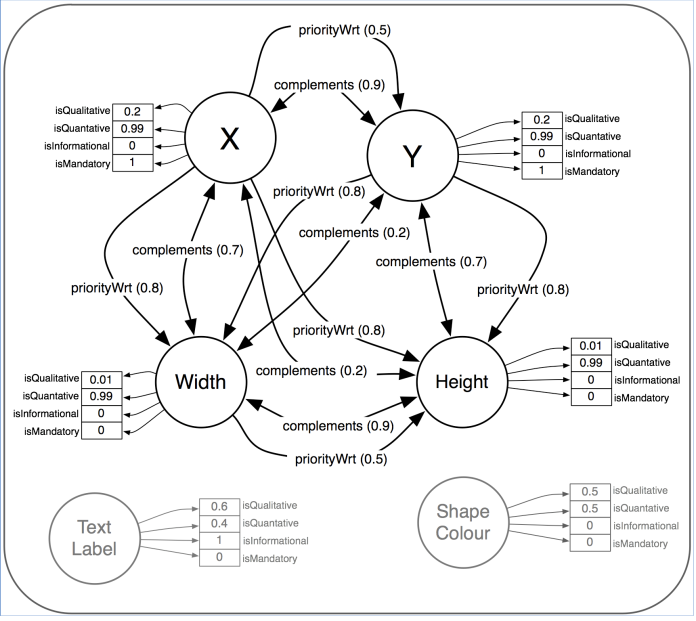 Visual Representation Ontology (VRO)
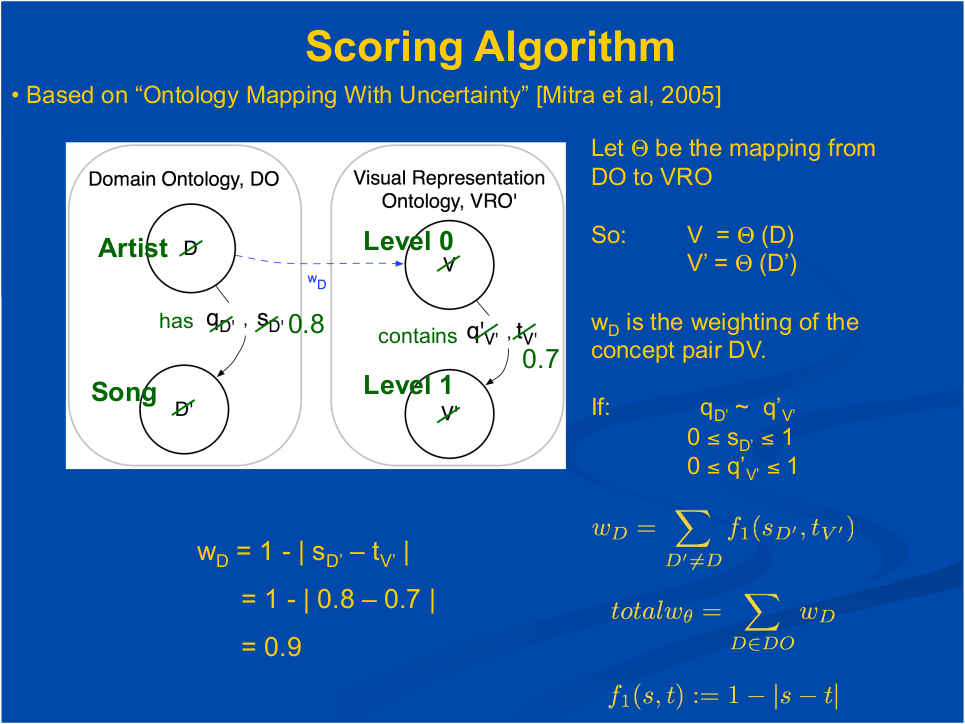 Scoring Algorithm
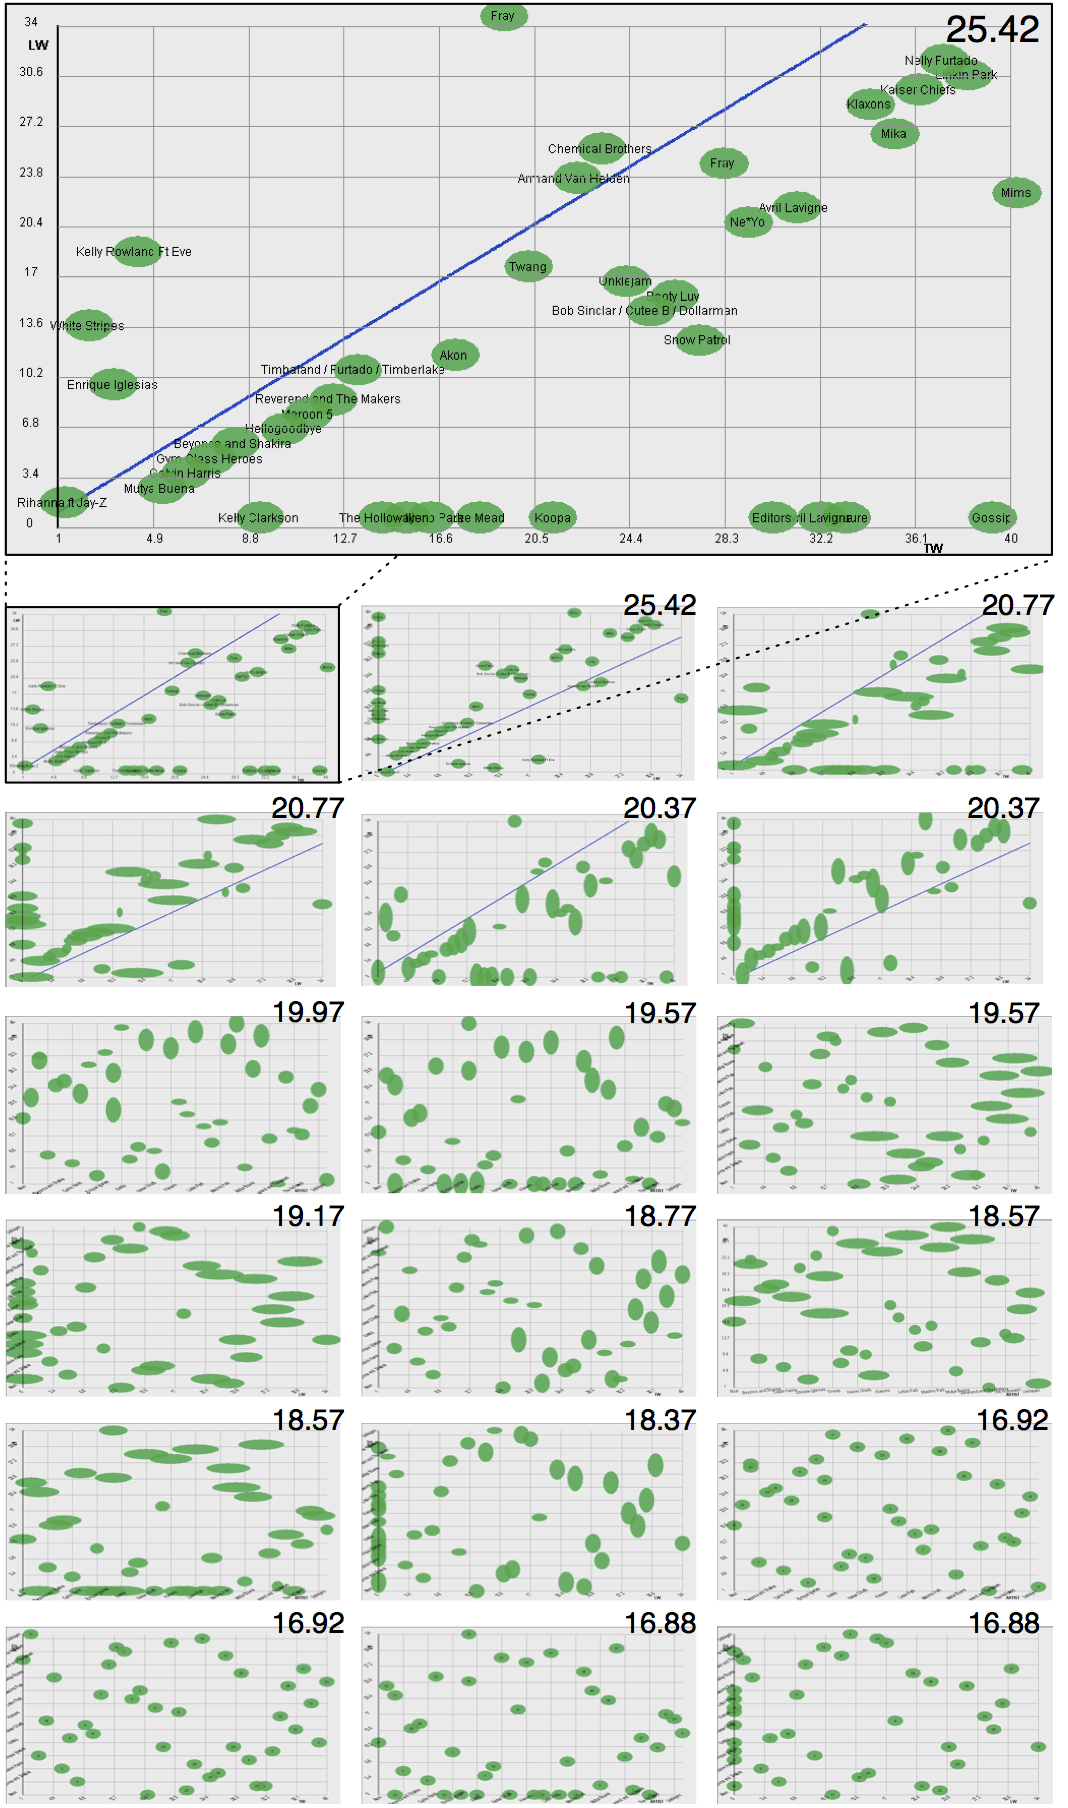 Scatter Plot Visualizations
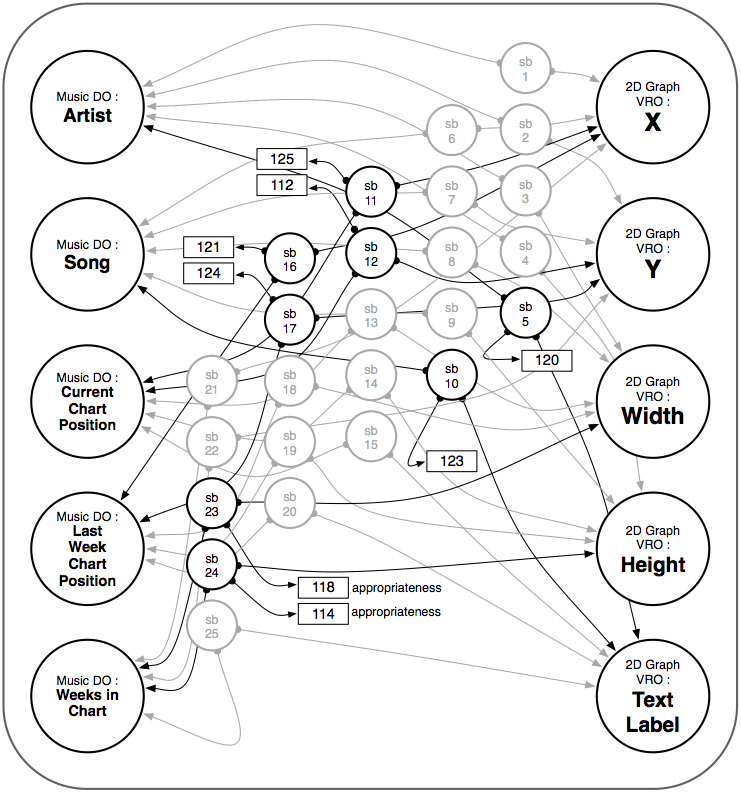 Semantic Bridge Ontology (SBO)
For more detail, see "From Web Data to Visualization via Ontology Mapping"